.png)
Bitcoin at Key Support: Is $68K the Next Bounce Zone or Breakdown Level?
- zcryptoresearchdes
- Feb 21
- 3 min read

Updated: Feb 21
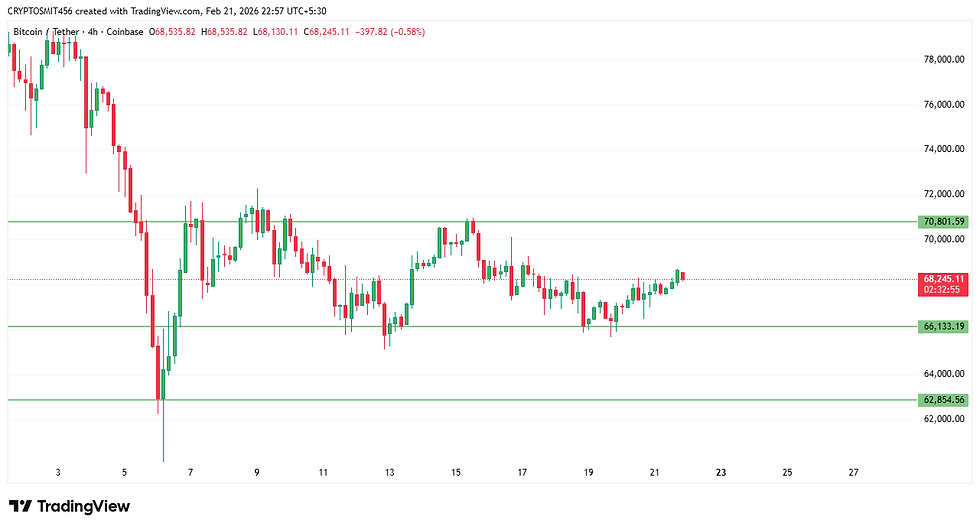
The $68,000 zone is not just another number on the chart. It is a technical and psychological level where buyers and sellers are fighting for control. What happens here could decide the short-term direction of the entire crypto market.
Is this a bounce opportunity or the start of a deeper correction?
Let’s break it down with data, not emotion.

Data and Explanation
1. Market Structure
On the 4-hour and daily time frame:
Higher highs are slowing down
Momentum is compressing
Volume is slightly declining
Bitcoin is still technically in a broader uptrend, but short-term structure is neutral to slightly weak unless buyers defend $68K strongly.
2. Funding Rates
Funding rates across major exchanges are slightly positive.
This tells us:
Long positions are dominant
Traders are leaning bullish
Overcrowded longs could become vulnerable
If funding increases too aggressively, it increases liquidation risk below support.
3. Open Interest Trend
Open interest has been rising while price is moving sideways.
This means:
Leverage is building
A volatility expansion is likely
A liquidation event could trigger a sharp move
When open interest rises without price expansion, it often leads to a breakout or breakdown soon.
4. Liquidation Heatmap Zones

Liquidity clusters are visible:
Below $66133
Above $70801
This suggests the market may attempt to sweep one side first before choosing direction. If $68K breaks cleanly, the next liquidity pocket lies around $66.5K to $67K.
5. Whale Accumulation vs Distribution
On-chain wallet tracking shows mixed signals:
Large wallets are not aggressively selling
Exchange inflows remain moderate
No panic-level distribution yet
This suggests whales are cautious but not exiting.
However, accumulation is also not aggressive at this level.
Risks and Scenarios
Scenario 1: Bullish Bounce
If $68K holds with strong volume:
Short positions may get squeezed
Price could retest $69.5K to $70.8k
Momentum traders re-enter
Confirmation signal:Strong bullish candle with volume expansion. This would maintain the higher timeframe uptrend.
Scenario 2: Breakdown Below $68K
The key confirmation: Daily close below support with increasing volume.
If support fails:
Liquidations below $67K get triggered
Funding resets
Price could move toward $66K zone
This does not automatically mean a bear market, but it would signal short-term weakness.

What do you think happens next at $68K?
Strong bounce toward $70K
Fake breakdown then recovery
Clean breakdown below $67K
Sideways consolidation continues
Conclusion
Right now, Bitcoin is not clearly bullish or bearish. It is compressing near a critical decision level. Data shows leverage building. Liquidity sits both above and below current price. Whales are neutral. Momentum is slowing. The next strong move will likely come from a liquidity sweep followed by expansion. For traders, patience is more powerful than prediction here. For investors, the broader trend still matters more than short-term noise.
$68K is not just support. It is a battlefield.
Frequently Asked Questions (FAQ)
1. Why is $68K an important support level for Bitcoin?
The $68K level is important because it previously acted as a breakout zone and consolidation area. When resistance turns into support, it becomes a key decision point where buyers often defend the price. A strong hold above this level may indicate bullish continuation, while a break below it can signal short-term weakness.
2. What happens if Bitcoin breaks below $68K?
If Bitcoin closes strongly below $68K with increasing volume, it may trigger liquidations and push price toward lower liquidity zones around $66K to $67K. However, a breakdown does not automatically mean a long-term bear market. It may simply be a short-term correction.
3. How do funding rates affect Bitcoin price movement?
Funding rates show whether traders are mostly long or short in the derivatives market. If funding rates are highly positive, it means too many traders are long, which increases the risk of a long squeeze. Balanced funding usually indicates a healthier market structure.
4. What does rising open interest indicate?
Rising open interest means more leveraged positions are entering the market. If price stays stable while open interest increases, it often signals that a sharp move is coming. That move can be either upward or downward depending on liquidity triggers.
5. Are whales accumulating Bitcoin at this level?
Current on-chain data shows moderate accumulation but no aggressive buying. Exchange inflows remain controlled, which suggests whales are not heavily distributing. This indicates caution rather than panic.
6. Is this a good time to buy Bitcoin?
This depends on your strategy and risk tolerance. Short-term traders may wait for confirmation of a bounce or breakdown. Long-term investors often focus more on macro trends rather than short-term volatility.
Disclaimer
This article is for educational and informational purposes only. It is not financial or investment advice. Cryptocurrency markets are highly volatile. Always conduct your own research and manage risk before making any trading or investment decisions.

Comments